Opioids, presidents, and auto sales: python graphing
Basic Graphing Assignment
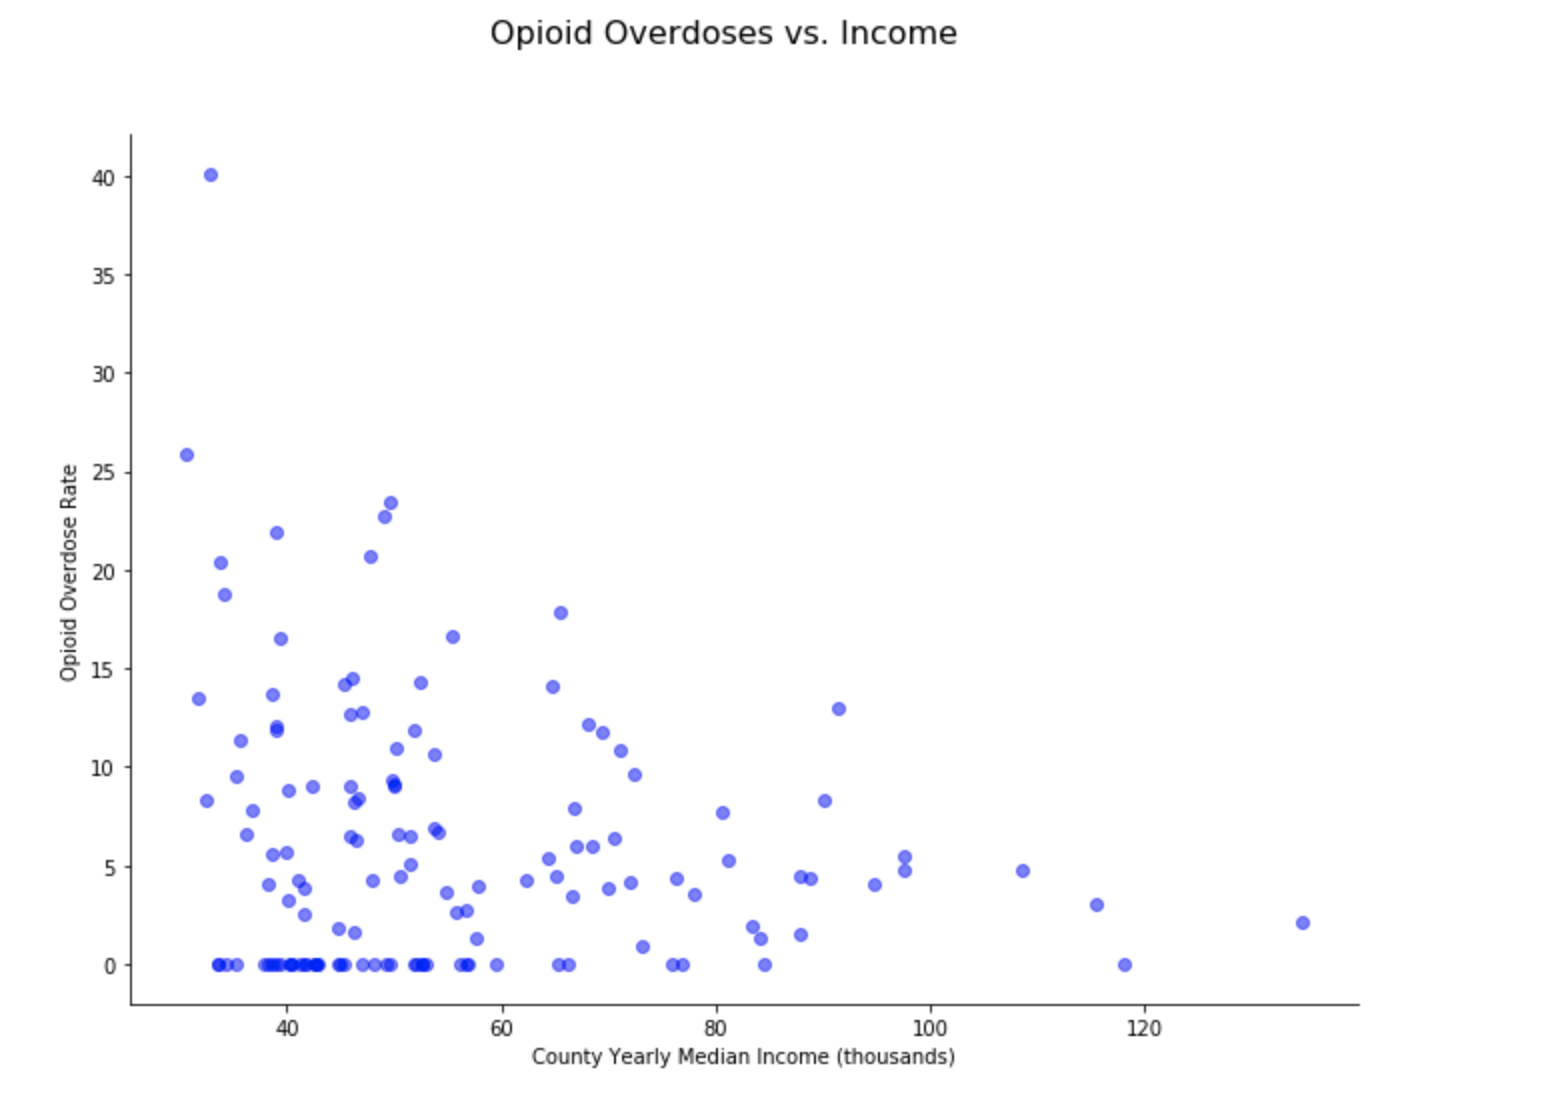
I’ve made some graphs for my Competing Through Business Analytics class. Two of them display data on the opioid crisis and overdose rates in Virginia.
Another is a histogram of presidents by state of birth.
The last is a line graph showing US auto sales over time since around 1970.
Check out the graphs here (jupyter notebook) or here (HTML) or check out the repo here